Application of multi-spectral indexes in monitoring temporal and spatial changes of vegetation using Modis satellite images in GEE system
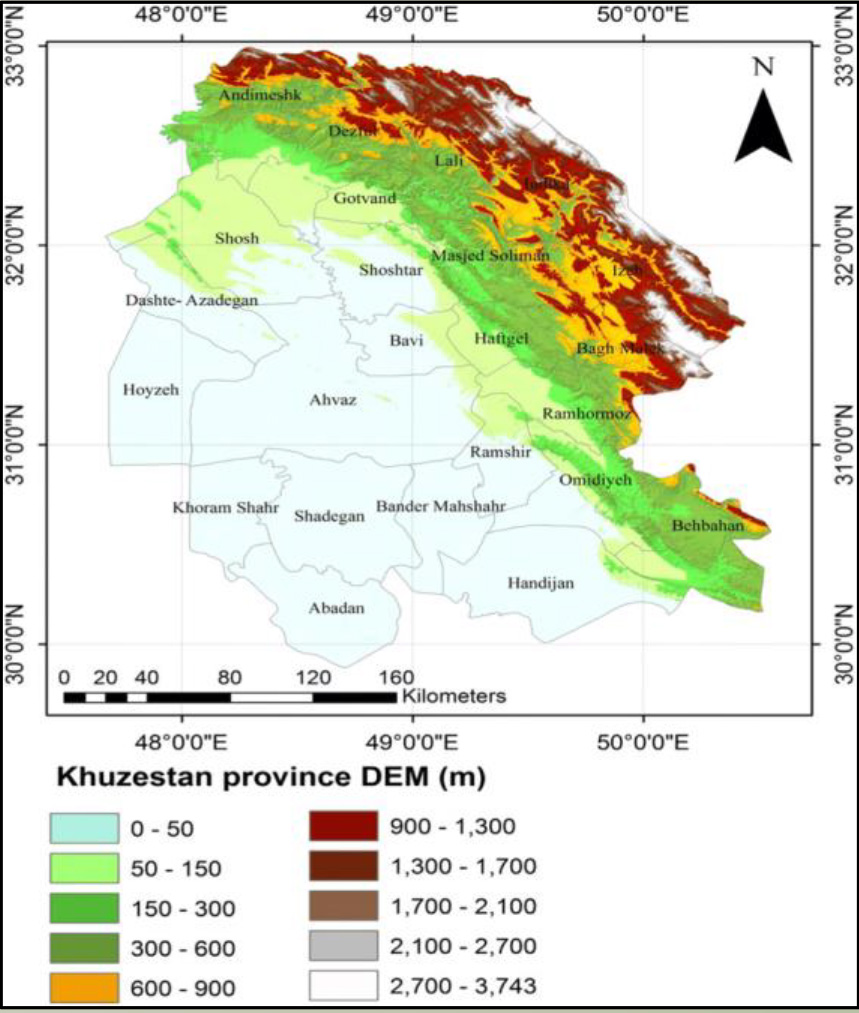
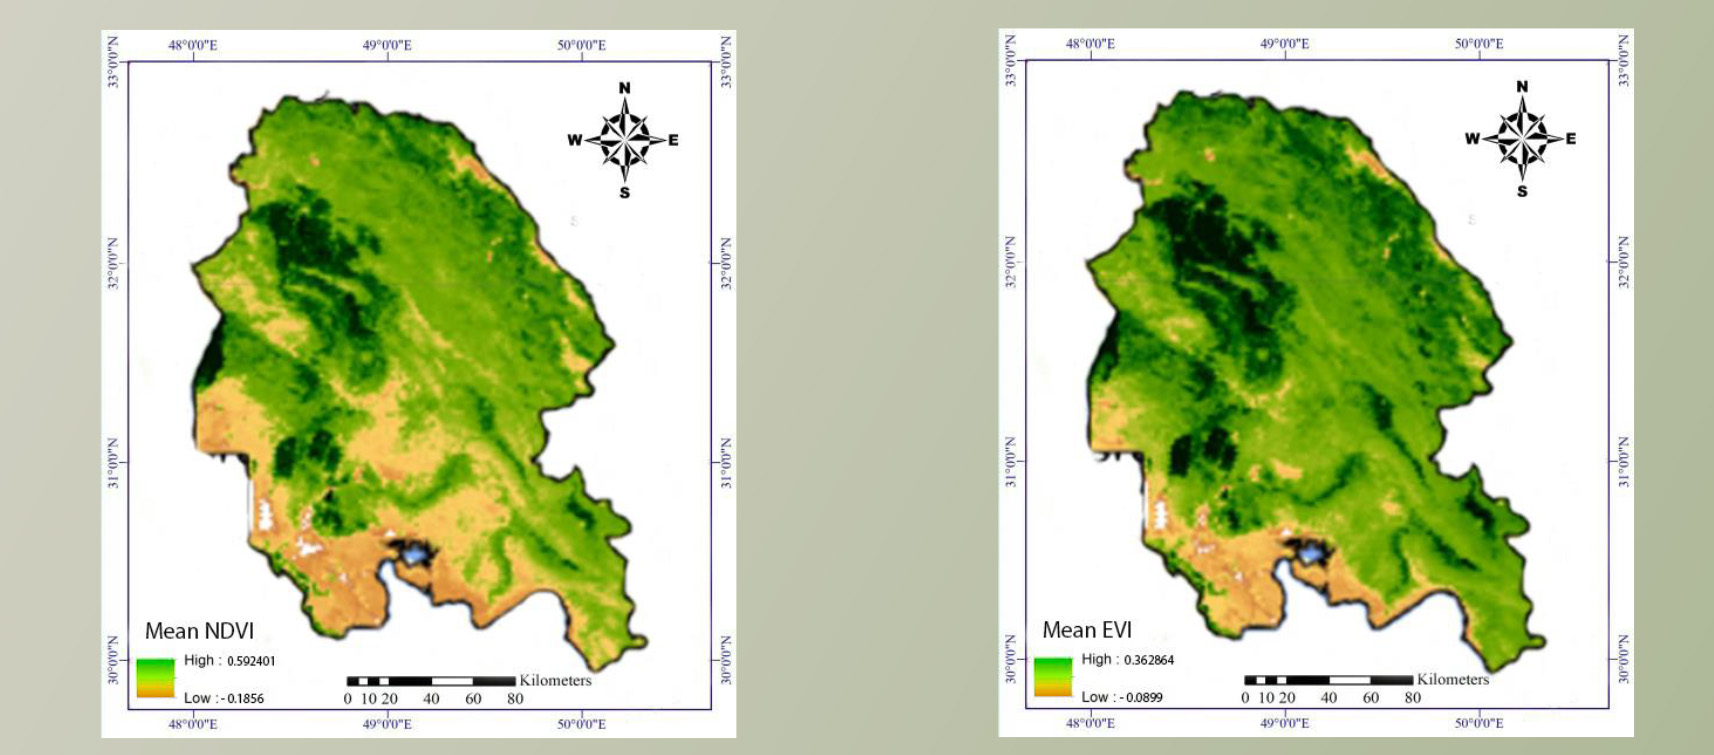
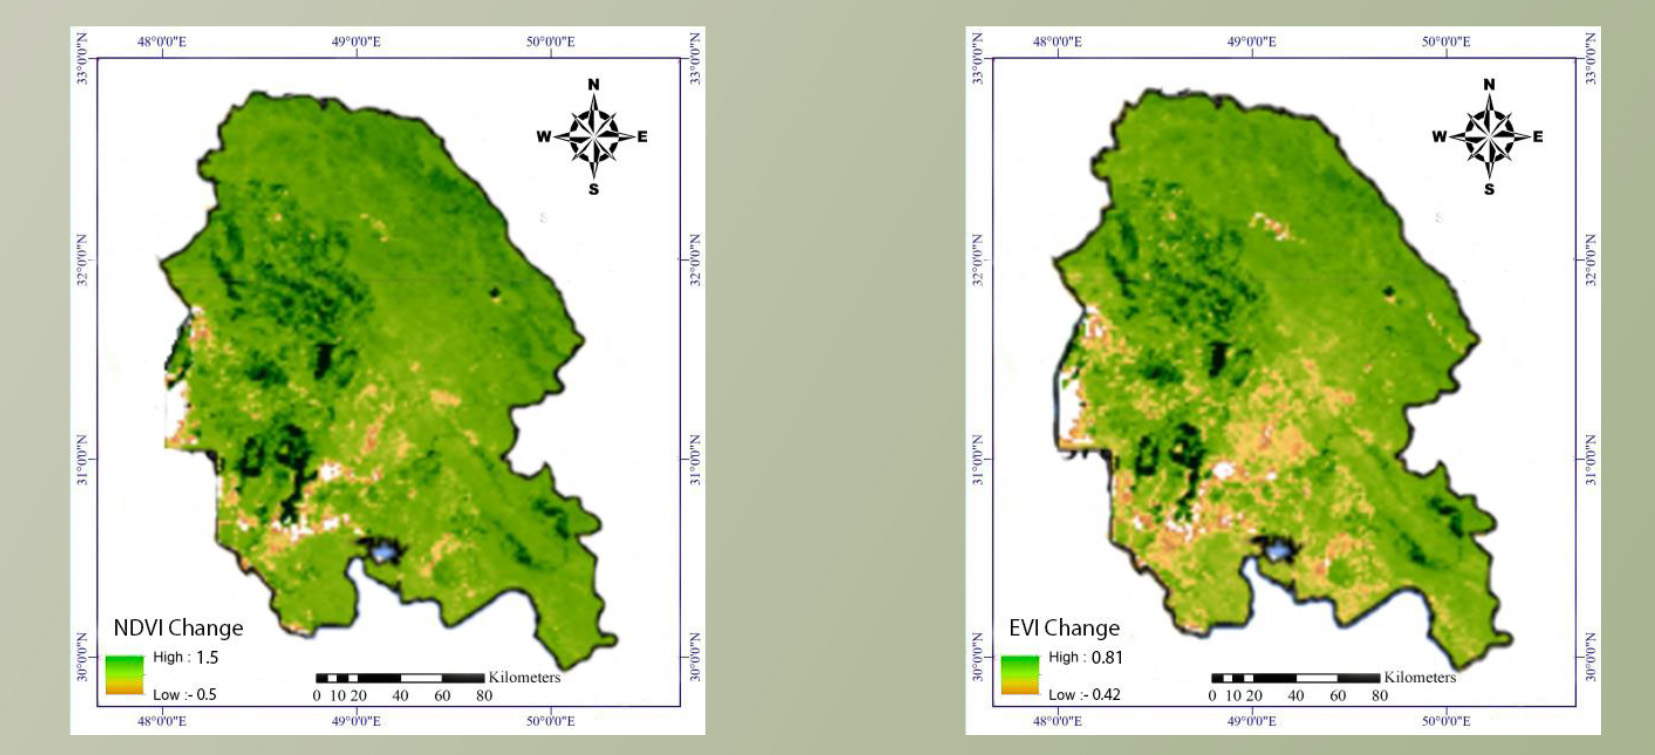
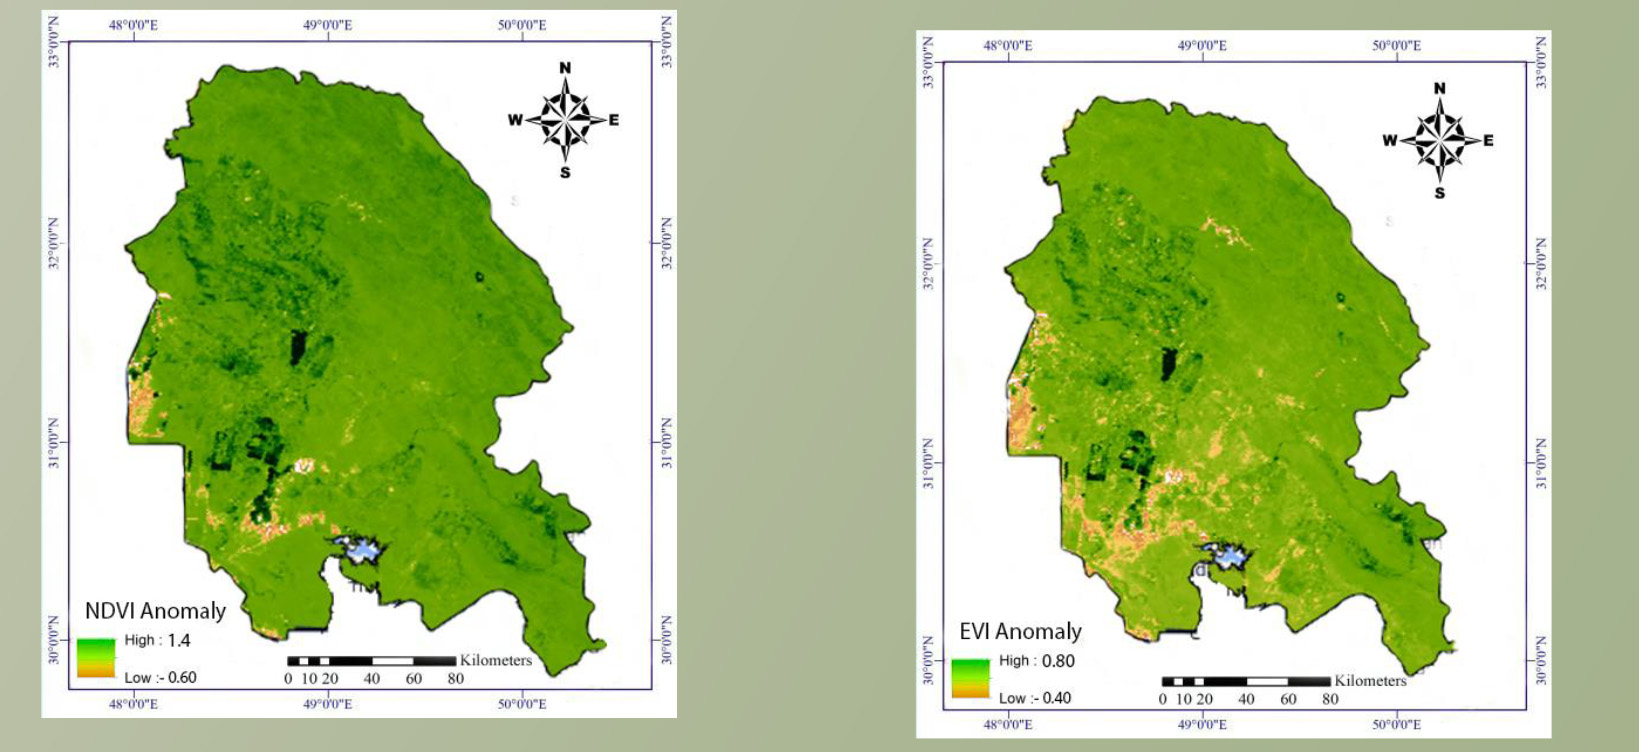
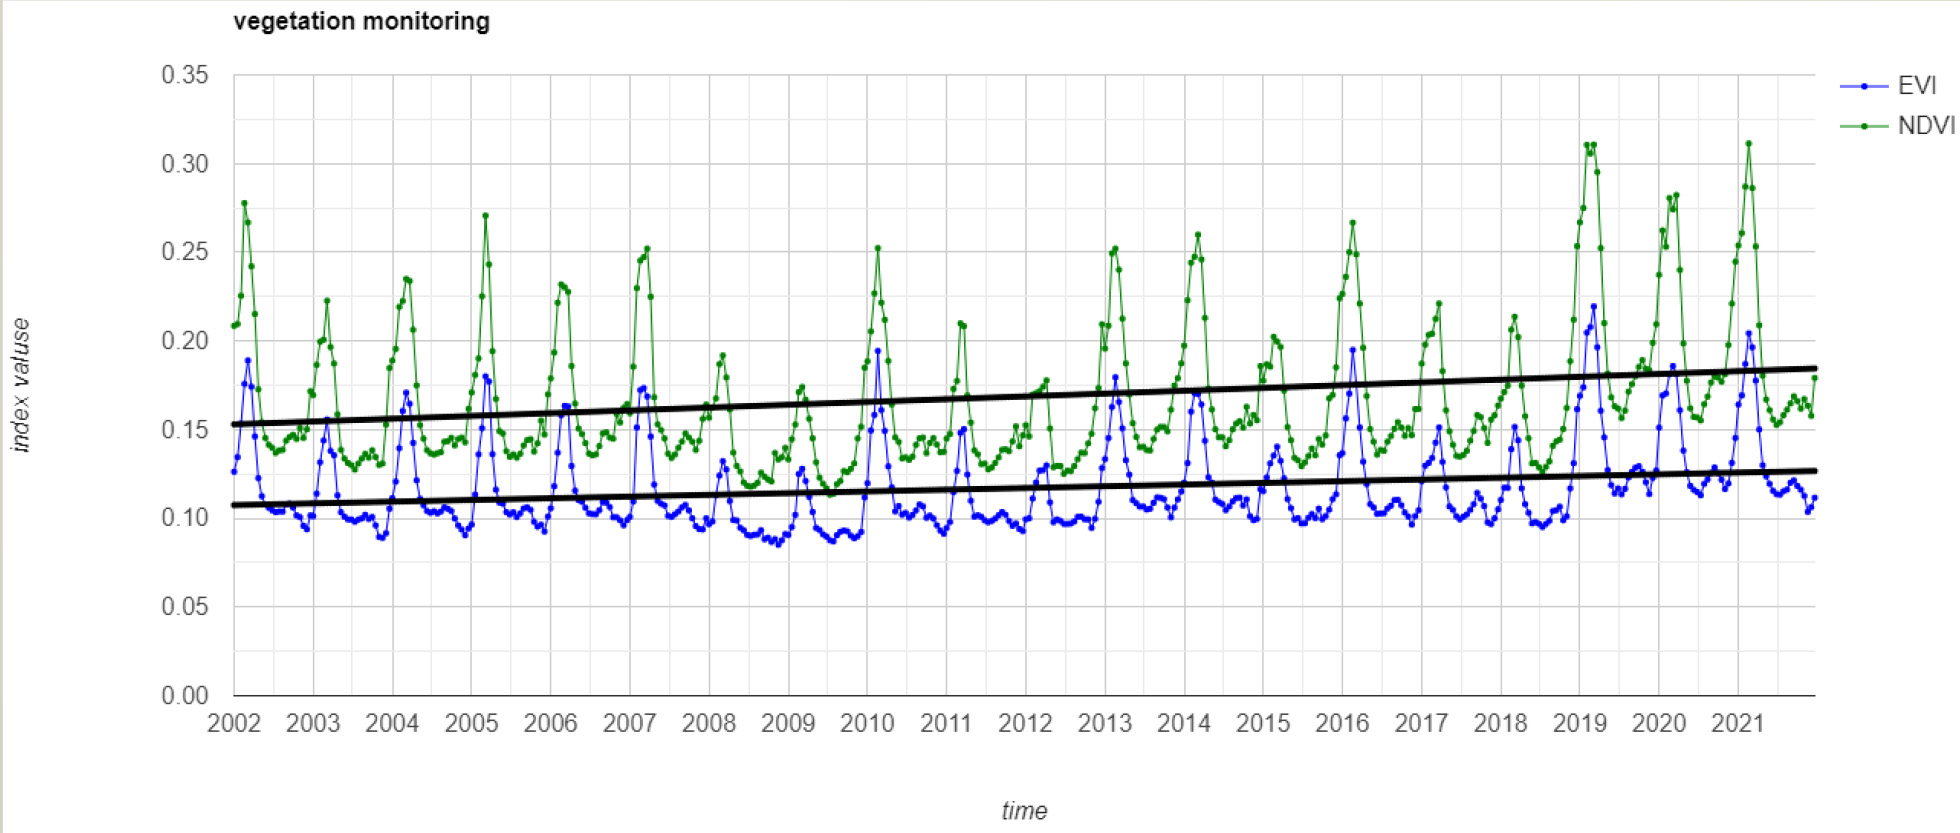
Vegetation change is one of the key indicators used to monitor environmental quality. Monitoring vegetation changes in arid and semi-arid regions is of particular importance due to the rare and sensitive nature of vegetation. Due to expected changes in vegetation, land productivity and biodiversity may be affected. In this direction, the use of time series of vegetation indices (EVI and NDVI) is used as a method to reflect the state of growth and phenology of vegetation. In this project, the multi-temporal products of the MODIS sensor (Terra satellite) including NDVI and EVI indicators have been used during the years 2002 to 2022. The studied area in this project is Khuzestan province. This province is in the southwest of Iran and in the geographical position of 38.4 It is located at 41° 48 north latitude and 31° 28° east longitude. The main reason for choosing this area is the height difference in the two northeastern parts of the province and the southern and southwestern parts, which creates two different types of climate in a short distance. has brought. In the chart of time changes, we see a shift between two indicators. The reason for the shift is the influence of the NDVI index on atmospheric noise and background soil. While the EVI index improves biomass estimation due to having correction coefficients under saturated conditions, this overestimation is also seen in the results of the maximum average and median maps related to the NDVI index, for example, the average map is visually We have shown that in the generated anomaly map, the points with high values of the index have appeared in green, and this shows that the values of the EVI or NDVI index in these areas were increasing over time, and the points with very low values and It has appeared in orange color and indicates that the values of the indicators have decreased over time.
- Industry : Class Project
- Tools : Google Earth Engine
- Date : 5 - 1 - 2023
- URL : ///
